
One of the most desirable benefits of the Istio service mesh is its incredible out-of-effort visibility it delivers in means of traffic flow & behaviour. In many cases, it’s the reason alone to adopt Istio for customers.
A short recap on Istio:
Istio is an open source service mesh solution that uses envoy as the side-car proxy in the data plane. Its main features are traffic management, security, observability and being platform independent. It natively supports Kubernetes.
ISTIO provides in high level the following pillars:
- Load balancing for HTTP, gRPC, WebSocket and TCP traffic.
- Fine-grained control of traffic behaviour and flow.
- Pluggable policy layer supporting API for access control, rate limits and quotas.
- Automatic visibility with aggregated metrics & traces from all the side-car proxies in the mesh.
- Secure service-to-service communication in a cluster with strong identity-based authentication and authorization.
In this post you can learn how to use metrics Istio provides (And the proxies in it) to autoscale Kubernetes workloads inside the mesh.
Mixer, which is a part of Istio’s control plane contains the istio-telemetry which is in charge of ingesting time series metrics from all the side-car proxies in the mesh. It ingests raw Envoy metrics, enrich or aggregates some, and expose them as new metrics — e.g. as Prometheus. For example, one of the core metrics is the istio_requests_total metric, which contains information on traffic such as source/destination, status codes, latency, traffic volume and more.
For example, looking at the Prometheus configuration delivered with Istio, we can observe the scrape configuration for the Istio mesh job:
scrape_configs:
- job_name: istio-mesh
  scrape_interval: 5s
  metrics_path: /metrics
  scheme: http
  kubernetes_sd_configs:
  - api_server: null
    role: endpoints
    namespaces:
      names:
      - istio-system
  relabel_configs:
  - source_labels: [__meta_kubernetes_service_name, __meta_kubernetes_endpoint_port_name]
    separator: ;
    regex: istio-telemetry;prometheus
    replacement: $1
    action: keep
The above definition is using Prometheus’s Kubernetes service discovery, and simply means: “scrape the endpoints istio-telemetry service through the prometheus (named) port which are found in the istio-system namespace”.
This job, make the istio_requests_total metric (among others) available in Prometheus.
Let’s leave Istio for now and do a recap on autoscaling workloads in Kubernetes.
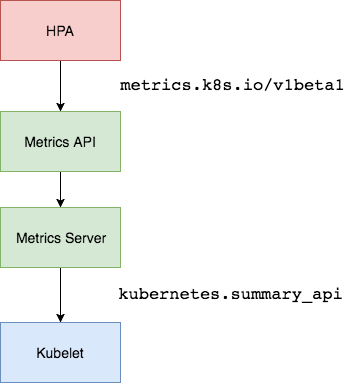
Kubernetes contains an API resource named HPA — HorizontalPodAutoscaler. HPA is in charge of autoscaling kubernetes workloads. By default, it allows you to scale according to cpu and memory usage of PODs within a deployment. This works out of the box with the metrics api, which the HPAs use themselves, to calculate current usage values.
kubectl get apiservice v1beta1.metrics.k8s.io
NAME                     AGE
v1beta1.metrics.k8s.io   60dkubectl get --raw /apis/metrics.k8s.io/v1beta1/namespaces/kube-system/pods | jq -r 'first(.items[])'
{
  "metadata": {
    "name": "kube-proxy-gke-highcpu-048834aa-b42v",
    "namespace": "kube-system",
    "selfLink": "/apis/metrics.k8s.io/v1beta1/namespaces/kube-system/pods/kube-proxy-gke-highcpu-048834aa-b42v",
    "creationTimestamp": "2019-04-14T13:10:35Z"
  },
  "timestamp": "2019-04-14T13:10:20Z",
  "window": "30s",
  "containers": [
    {
      "name": "kube-proxy",
      "usage": {
        "cpu": "7137682n",
        "memory": "26296Ki"
      }
    }
  ]
}
Now, any metric that is either cpu nor memory is considered as a custom metric. Custom metrics in Kubernetes involves using a separate api — the custom metrics api — and it does not supply any time series metrics for you by default. Rather, you need to do that yourselves using a feature by Kubernetes named API aggregation.
The API aggregation feature in Kubernetes — a part of the API Extensibility capabilities of Kubernetes — allows (APIService) to claim any available url under the Kubernetes api. All requests to this api are hence proxied to a service (Defined in the APIService) that runs in the cluster.
Actually the metrics api discussed above, is claimed by the metrics server out of the box.
Lets run the command we previously ran, but now lets observe the full object.I narrowed it down to the relevant sections but you can try it on every Kubernetes cluster.
kubectl get apiservice v1beta1.metrics.k8s.io -oyaml
apiVersion: apiregistration.k8s.io/v1
kind: APIService
metadata:
  labels:
    addonmanager.kubernetes.io/mode: Reconcile
    kubernetes.io/cluster-service: "true"
  name: v1beta1.metrics.k8s.io
spec:
  group: metrics.k8s.io
  insecureSkipTLSVerify: true
  service:
    name: metrics-server
    namespace: kube-system
  version: v1beta1

As this is an example that exists in any proper fresh Kubernetes cluster, the registration of the custom metrics api needs to done by the admin. It’s worth mentioning that the custom metrics api url is special compared to other user-defined ones in a sense that HPAs uses it by default when defined with custom metrics. Still, this url is not claimed by default and running kubectl get apiservice will not list it on a fresh cluster.
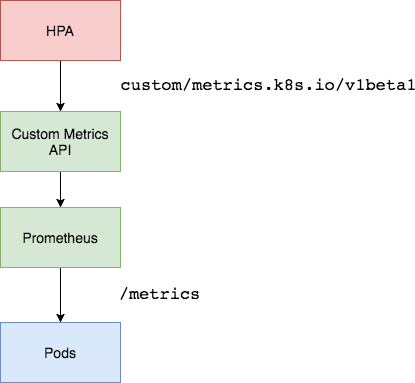
We will see in just a minute how to register a Prometheus adapter to this url, but for now, assuming we did registered, HPAs can work with customer metrics as illustrated (with Prometheus example) :
Lets stop for a second and see what parts we have covered and what is left for us to get to where we want — scale a deployment with an Istio metric.
- We know that Istio provides metrics and that they are being scraped with Prometheus that is delivered with the Istio chart.
- We know we can claim the custom metrics api url so all requests to it by an HPA will be proxied to the server that is registered under this url (defined by the APIService Kubernetes resource)
All that is left is to connect the dots — choose a metric and register an apiservice (that pulls that metric from the ISTIO mesh) under the custom metrics api and test it with an HPA.
We already have a Prometheus server in the istio-system namespace that does that. YAY! But not so fast…
HPA works on a pod level metrics and calculates it self the average so you can scale on a target average. The istio_requests_total, which is available in this Prometheus by default is already aggregated on service level. This will only confuse the HPA and we will get undesired results. Sure, we can use a calculation somehow like this:
istio_requests_total / #pods in the service
This means that the HPAs are dependant on the istio-telemetry availability and it means that its less realtime that getting metrics directly from the PODs. However, it is doable.
An alternative, more independent way is to use the envoy metrics collected by the ISTIO delivered prometheus server. These are POD level metrics! since every pod has an envoy injected into it in the mesh. Every envoy in an ISTIO mesh by default exposes prometheus metrics under the /stats/prometheus endpoint.
You can observe the relevant Prometheus scrape job ‘envoy-stats’ that comes with Istio. It’s very long so I’m not including the full spec here.
- job_name: 'envoy-stats'
      metrics_path: /stats/prometheus
      kubernetes_sd_configs:
      - role: pod.....
The metric I want to use is requests per second or in the envoy prometheus metrics ‘envoy_http_rq_total’. unfortunately the default envoy_stats job configuration excludes this metric (while include many others), but you can easily include it if you replace the setting in the envoy_stats job under metric_relabel_configs of:
- source_labels: [ http_conn_manager_prefix ]
  regex: '(.+)'
  action: drop
with:
- source_labels: [ http_conn_manager_prefix ]
  regex: '(0\.0\.0\.0_).*'
  action: drop
If you don’t understand why, feel free to contact me!
NOTE: for the newer versions of Istio — by default — the envoy proxies do notreport this metric. in order for it report it, so it can be scraped by prometheus, you need to add it with the http key in the annotation: sidecar.istio.io/statsInclusionPrefixes in the pod template section in the deployment. for more information check https://istio.io/docs/ops/telemetry/envoy-stats/
Assuming we made this change, on the Prometheus side we can now see this metric:
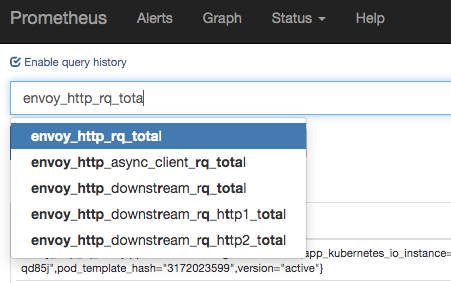
Yay! The metric can be seen now in prometheus. Now let’s make queries to the custom metrics api be proxies to this Prometheus server.
For that we have ready-to-deploy chart of the prometheus adapter. https://hub.kubeapps.com/charts/stable/prometheus-adapter
This chart will create an APIService — v1beta1.custom.metrics.k8s.io — and will direct the requests to it to the adapter deployment which is also part of the chart.
You can install for example like that:
helm upgrade --install --namespace $MONITORING_NAMESPACE custom-metrics stable/prometheus-adapter \
--set=prometheus.url=http://prometheus.istio-system \
--version $PROMETHEUS_ADAPTER_VERSION --wait
For HA, the chart support podAntiAffinities and replicaCount parameters.
We need to reconfigure it so it queries what we want from the ISTIO’s Prometheus server, which now has our requested metric.
apiVersion: v1
kind: ConfigMap
metadata:
  labels:
    app: prometheus-adapter
    chart: prometheus-adapter-v0.4.1
    heritage: Tiller
    release: custom-metrics
  name: custom-metrics-prometheus-adapter
  namespace: prometheus-operator
data:
  config.yaml: |
    rules:
    - seriesQuery: '{container_name!="POD",namespace!="",pod_name!=""}'
      seriesFilters: []
      resources:
        overrides:
          namespace:
            resource: namespace
          pod_name:
            resource: pod
      name:
        matches: "envoy_http_rq_total"
        as: ""
      metricsQuery: sum(rate(<<.Series>>{<<.LabelMatchers>>}[1m])) by (<<.GroupBy>>)
You can set this configuration while installing the chart, giving the helm command the parameters, but I found it hard and not needed. You can use the above CM as reference. If you did apply the above cm after installation, you need to rollout the deployment of the adapter…
kubectl patch deployment custom-metrics-prometheus-adapter -p "{\"spec\":{\"template\":{\"metadata\":{\"labels\":{\"date\":\"`date +'%s'`\"}}}}}" -n $MONITORING_NAMESPACE
You should now be able to see the apiservice object
kubectl get apiservice v1beta1.custom.metrics.k8s.io -oyaml
apiVersion: apiregistration.k8s.io/v1
kind: APIService
metadata:
  labels:
    app: prometheus-adapter
    chart: prometheus-adapter-v0.4.1
    heritage: Tiller
    release: custom-metrics
  name: v1beta1.custom.metrics.k8s.io
spec:
  group: custom.metrics.k8s.io
  insecureSkipTLSVerify: true
  service:
    name: custom-metrics-prometheus-adapter
    namespace: prometheus-operator
  version: v1beta1
And be able to see the following:
kubectl get --raw "/apis/custom.metrics.k8s.io/v1beta1/namespaces/istio-system/pods/*/envoy_http_rq_total" | jq -r 'last(.items[])'{
  "describedObject": {
    "kind": "Pod",
    "namespace": "istio-system",
    "name": "istio-telemetry-7f6bf87fdc-xn489",
    "apiVersion": "/v1"
  },
  "metricName": "envoy_http_rq_total",
  "timestamp": "2019-04-14T14:51:29Z",
  "value": "70377m"
}
This means the pod istio-telemetry-7f6bf87fdc-xn489 has currently 70.3 requests per second in the last minute…
And now define an HPA with this metric so a deployment can scale on the average RPS of its pods.
apiVersion: autoscaling/v2beta1
kind: HorizontalPodAutoscaler
metadata:
  name: rps-hpa
spec:
  scaleTargetRef:
    apiVersion: extensions/v1beta1
    kind: Deployment
    name: test-deploy
  minReplicas: 3
  maxReplicas: 10
  metrics:
  - type: Pods
    pods:
      metricName: envoy_http_rq_total
      targetAverageValue: 75
Listing the HPA will look something like this (clean view):
kubectl get hpa -n test
NAME     REFERENCE     TARGETS    MINPODS    MAXPODS  REPLICAS   AGE
rps-hpa  test-deploy   62023m/75  3          10       3          1d
which means ±62 requests per second while that target utilisation the HPA will autoscale according to will be 75.
You might notice that, really, scaled according to an Envoy metric.
Nonetheless, you can apply the above to any other Envoy metric in Istio, or use an Istio generated metric like the istio_requests_total. All are scraped from istio-telemetry by Prometheus and that’s what’s important.
Feel free to ask anything.
Iftach Schonbaum (Linkedin).
